Your First Distributed System Debug Will Humble You (And That’s Good)
Welcome to the Theater of Chaos
You’ve built beautiful monoliths. Your unit tests are pristine. Your code coverage makes other engineers weep with joy. Then someone suggests moving to microservices, and suddenly you’re staring at a distributed system where a simple user login involves seventeen different services, three message queues, two databases, and what appears to be a sentient load balancer with trust issues.
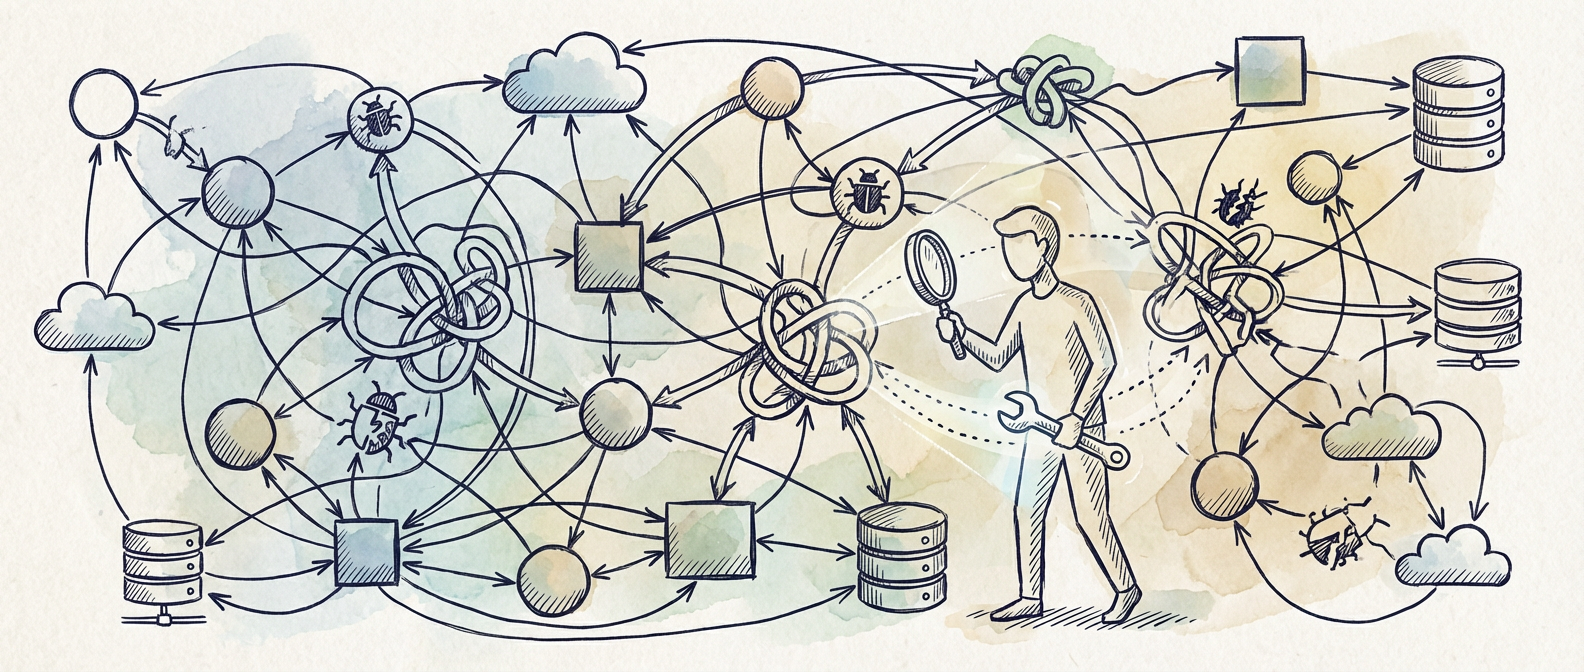
The first time you try to debug why Sarah from accounting can’t log in while everyone else can, you’ll discover something sobering. Distributed systems debugging is less like solving a puzzle and more like being a detective in a noir film where all the witnesses are unreliable narrators who speak different languages. The good news is that everyone goes through this. The better news is that you can learn to love the chaos.
Let me save you some 3 AM coffee and existential dread by walking you through what actually matters when you’re starting out. Forget the enterprise monitoring solutions that cost more than your car. We’re going to build debugging superpowers with tools you can set up in an afternoon.

Correlation IDs Are Your New Best Friend
Before you do anything else, before you even think about fancy observability platforms, implement correlation IDs. This is the single most important debugging tool you can add to a distributed system, and it’s criminally simple. A correlation ID is just a unique identifier that follows a request as it bounces between services like a particularly determined pinball.
Here’s how it works: when a request enters your system, generate a UUID and attach it to every log message, every database query, every service call that happens as part of processing that request. When Sarah can’t log in, you search for her correlation ID and suddenly you can see the entire story unfold across all your services. No more playing “which service failed when” with timestamps that may or may not be synchronized.
Start with this in your application code. Add a middleware that generates or extracts correlation IDs from headers. Log them everywhere. Yes, everywhere. Your future self debugging a production issue at 2 AM will thank you when they can trace Sarah’s failed login from the web server through the authentication service to the exact database query that timed out because someone decided to run analytics during peak hours.
Structured Logging: Because grep Has Limits
Text logs are fine until you have twelve services each writing their own special snowflake log format. JSON structured logging feels like overkill until the day you need to aggregate logs from multiple services and realize that parsing “User login failed at 2023-01-15T10:30:45Z for user sarah@company.com due to timeout” with regex is the path to madness.
Switch to structured logging now, while your system is still small enough to change without requiring a team meeting and three rounds of approval. Use consistent field names across services. If one service logs user_id and another logs userId, you’ll spend more time writing log aggregation queries than actually debugging. Pick a standard and stick to it religiously.
The beauty of structured logs becomes apparent when you can query across all your services with something like “show me all ERROR level logs for user_id=12345 in the last hour.” Suddenly you’re not grep-ing through gigabytes of text files hoping you spelled “authentication” correctly. You’re running precise queries that give you exactly the data you need.
For your first distributed system, start with a simple centralized logging setup. Ship all your JSON logs to a single place where you can search and filter them. Elasticsearch and Kibana are overkill for most startups, but even a simple log aggregation script that dumps everything into a database you can query will transform your debugging experience.
Health Checks and Circuit Breakers: Failing Fast and Gracefully
Distributed systems fail in creative ways. Services don’t just die cleanly. They limp along returning errors 30% of the time, or they start responding to health checks but timing out on actual requests, or they become philosophical and start questioning the nature of HTTP status codes. This is why health checks need to be more sophisticated than “is the process running?”
Build health checks that actually verify your service can do its job. If your authentication service needs to talk to a database, your health check should try to connect to that database. If it needs to call another service, include that in the health check. Yes, this means your health checks can fail even when your service process is running perfectly. That’s the point.
Circuit breakers are the next level of defensive programming. When your authentication service notices that the user database is timing out on every request, a circuit breaker will stop making those calls and start returning errors immediately instead of making users wait 30 seconds for each timeout. This prevents cascade failures where one slow service brings down everything that depends on it.
Implement a simple circuit breaker pattern in your service calls. After a certain number of failures, open the circuit and fail fast. After some time, try again. If it works, close the circuit. If not, stay open. This single pattern will prevent more production disasters than any amount of sophisticated monitoring.
Start Simple, Evolve Deliberately
You don’t need Jaeger, Prometheus, Grafana, and a distributed tracing platform on day one. You need correlation IDs, structured logs, and basic health monitoring. Build these foundations first, and build them well. The fancy observability tools become incredibly powerful when they’re built on top of solid logging and monitoring practices.
The real skill in debugging distributed systems isn’t knowing which expensive tool to buy. It’s developing the methodical thinking that lets you isolate problems quickly. When you can trace a request through your system using correlation IDs, when your logs tell a coherent story across services, and when your services fail fast instead of limping along, you’ll find that debugging becomes less about luck and more about systematic investigation.
Start with one correlation ID, one structured log format, and one decent health check. Deploy it, break something in staging, and practice debugging it. The muscle memory you build doing this deliberately will serve you well when you’re debugging something genuinely urgent in production. And trust me, that day will come sooner than you think.
What’s your most memorable distributed systems debugging war story? I’d love to hear about the creative ways your services have found to fail, and the equally creative solutions you’ve built to catch them in the act.

How to Share Files Through iCloud Drive Without Losing Control of Your Data
Car Insurance Companies
Why iCloud Backup Takes So Long (and What to Do About It)
About Author
